

AI Observability: Monitoring Costs, Latency, and Quality
A comprehensive guide to monitoring AI applications in production -- tracking costs per request, measuring latency percentiles, and ensuring output quality at scale.
David Liu
Senior Engineer
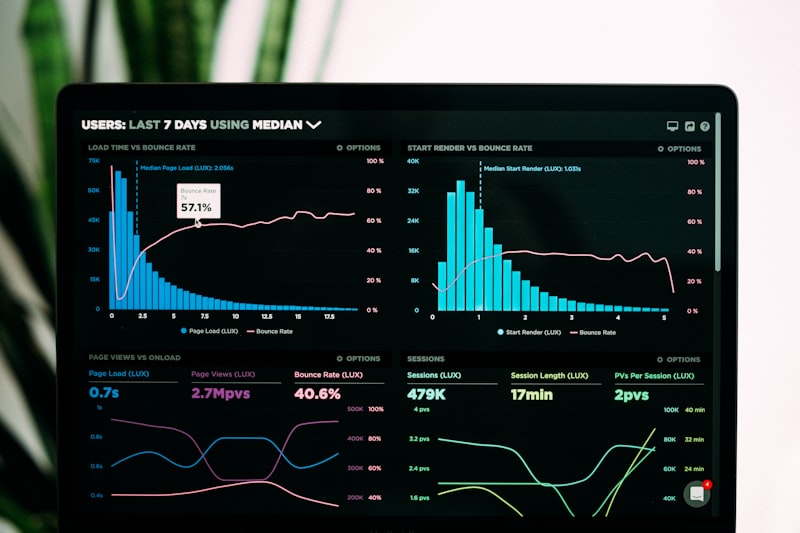
Traditional application monitoring tracks uptime, error rates, and response times. AI applications need all of that plus a new dimension: the quality and cost of AI-generated outputs. Without proper observability, teams discover problems through customer complaints and surprise bills rather than dashboards and alerts.
Here is a complete framework for AI observability in production.
The Three Pillars of AI Observability
AI observability extends the traditional observability pillars (metrics, logs, traces) with AI-specific concerns:
Cost observability tracks how much you spend per request, per feature, per customer, and per model. Without this, your AI costs are a black box until the monthly invoice arrives.
Latency observability monitors response times across providers and models, identifying slow queries before they impact user experience.
Quality observability measures whether AI outputs meet your standards over time, catching model degradation and prompt regression before users notice.
Cost Monitoring in Practice
The first step to cost control is visibility. OpenModex tracks costs automatically on every request, but you can enhance this with custom dimensions:
const response = await client.chat.completions.create({
  model: "auto",
  messages: messages,
  metadata: {
    feature: "customer-support-bot",
    customer_tier: "enterprise",
    environment: "production",
  },
});

// Response includes cost breakdown
console.log(response.usage);
// {
//   prompt_tokens: 245,
//   completion_tokens: 182,
//   total_tokens: 427,
//   cost_usd: 0.00234,
//   model_used: "anthropic/claude-haiku-4-5",
//   cache_hit: false
// }
With custom metadata, you can answer questions like:
- Which feature consumes the most AI budget?
- What is the per-customer cost of AI features?
- How do costs differ between production and staging?
Setting Cost Alerts
Configure alerts to catch runaway costs before they become expensive surprises:
# Configure cost alerts via API
client.alerts.create(
    name="daily-cost-limit",
    type="cost",
    threshold=500.00,        # Alert when daily cost exceeds $500
    window="24h",
    channels=["slack", "email"],
)

client.alerts.create(
    name="per-request-anomaly",
    type="cost_per_request",
    threshold=0.50,          # Alert on any request costing > $0.50
    channels=["slack"],
)
Latency Monitoring
Average latency is a misleading metric. A 200ms average can hide the fact that 5% of your users experience 10-second response times. Monitor percentiles instead.
Key latency metrics to track:
- p50 (median): The typical user experience
- p95: The experience for the slower 5% of requests
- p99: Worst-case latency (excluding extreme outliers)
- Time to first token (TTFT): For streaming responses, how long users wait before seeing any output
OpenModex's analytics API provides all of these breakdowns:
metrics = client.analytics.latency(
    start_date="2026-01-01",
    end_date="2026-01-31",
    group_by="model",
    percentiles=[50, 95, 99],
)

for model_metrics in metrics:
    print(f"{model_metrics.model}:")
    print(f"  p50: {model_metrics.p50_ms}ms")
    print(f"  p95: {model_metrics.p95_ms}ms")
    print(f"  p99: {model_metrics.p99_ms}ms")
Latency Budgets
Define latency budgets for different features and alert when they are exceeded:
- Interactive chat: p95 < 2 seconds
- Autocomplete/suggestions: p95 < 500ms
- Background processing: p95 < 30 seconds
Quality Monitoring
Quality is the hardest pillar to measure because "good output" is subjective and task-dependent. Here are practical approaches:
Automated Quality Checks
Use a cheaper, faster model to evaluate outputs from your primary model:
async function evaluateQuality(prompt: string, response: string): Promise<number> {
  const evaluation = await client.chat.completions.create({
    model: "openai/gpt-4o-mini",  // Cheap evaluator
    messages: [
      {
        role: "system",
        content: "Rate the following AI response on a scale of 1-5 for relevance, accuracy, and completeness. Return only the numeric score.",
      },
      {
        role: "user",
        content: `Prompt: ${prompt}\n\nResponse: ${response}`,
      },
    ],
  });

  return parseFloat(evaluation.choices[0].message.content ?? "0");
}
Run this evaluator on a sample of production requests (5-10% is usually sufficient) and track the scores over time. A declining trend indicates prompt regression or model degradation.
User Feedback Loops
Implement thumbs-up/thumbs-down feedback on AI outputs and correlate feedback with request metadata:
// Log user feedback with request context
await client.feedback.log({
  request_id: response.id,
  rating: "positive",   // or "negative"
  comment: "Accurate and helpful",
});
Track your positive feedback rate over time. A sudden drop from 85% to 70% positive indicates a problem worth investigating.
Building Your Dashboard
A production AI observability dashboard should surface these views:
- Cost overview: Daily spend with trend line, broken down by model and feature
- Latency heatmap: p50/p95/p99 latency across models and time periods
- Cache performance: Hit rate, miss rate, and estimated savings
- Quality scores: Automated evaluation scores and user feedback trends
- Error rates: Failed requests by type (timeout, rate limit, provider error)
- Routing decisions: Which models are being selected by smart routing and why
OpenModex provides all of these views in the built-in dashboard. For teams that prefer custom dashboards, our analytics API exports all data in a format compatible with Grafana, Datadog, and other monitoring platforms.
What is Next
Observability is not a one-time setup -- it is a practice. Review your AI metrics weekly, investigate anomalies promptly, and use the data to make informed decisions about model selection, prompt engineering, and cost optimization.
The teams that treat AI observability as a first-class concern are the ones that scale AI features confidently, knowing they will catch problems before their users do.